

Environment Agency Field Test Report – TIENet™ 360 LaserFlow™
Richard Severn, Environment Agency, May 2014
Teledyne ISCO (USA) recently released the first non-contact open channel sub surface laser flow meter. RS Hydro (www.rshydro.co.uk) is a UK distributor for the LaserFlow™ and supplied the test unit. Mounted above the water surface the LaserFlow™ measures point velocity at up to fifteen different points at three different depths below the water’s surface using a laser diode that transmits and receives a focused laser light beam. Velocity is calculated from the Doppler-shifted signal frequency that is returned.
Executive Summary
A field test has been undertaken to evaluate the performance of the LaserFlow™ in open channel river systems. The accuracy of the flow data has been assessed to determine the potential of using a laser velocimeter in the Environment Agency’s hydrometric network. This report details some results of the evaluation process, testing the instrument under ideal flow measurement conditions. Results show the LaserFlow™ measures discharge to within the measurement uncertainty of the reference flows. Test results indicate the unit would be suitable at locations similar to bed and wall-mounted hydro-acoustics. Its ability to measure velocity in weedy channels also needs investigation. The Laser is a class 3R beam (same classification as a laser pointer in the USA), so installation at sites where the instrument can be accessed by the public should be avoided.
Field Tests
This test report details the performance of the TIENet™ 360 LaserFlow™ compared against a Sarasota 2000 ultrasonic time-of-flight flow meter and FlowTracker spot gaugings. The test site was at the Environment Agency’s stream flow gauging station on the River Leen in Nottingham. The measuring reach has a long straight approach with a symmetrical velocity profile, which limits other sources of error such as skew flow and eddying.
Objectives of trial:
- Evaluate performance of the LaserFlow™ meter against an existing flow gauge.
- Assess the potential for non-contact LaserFlow technology to be used in the Environment Agency flow monitoring network.
- Determine the installation requirements and operating range of the instrument.
- Establish current retail price of the LaserFlow.
Test site and Installation
A test site was selected on the River Leen in Nottingham (NGR SK 550 393) which is an operational flood warning gauge and listed on the National River Flow Archive (station no. 28035). The measuring reach is a concrete lined rectangular channel 3.07 metres wide. Downstream a non-standard control weir provides a minimum afflux of 0.27 metres.
The LaserFlow™ was mounted on a gantry, with the base of the sensor suspended 2.71 metres above the river bed. Historic data from the existing gauge record shows discharge can range between 0.06 m³s-1 at low flows to a peak flowrate of 8.0 m³s-1. The mean channel velocity varies from 0.08 m³s-1 up to 1.6 m s-1 (the expected velocity range to be measured by the LaserFlow’s™ velocimeter). The minimum expected river depth is 0.29 metres up to a maximum of 2.0 metres.
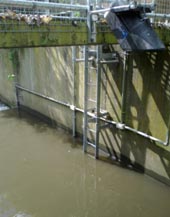 For testing purposes, the LaserFlow™ flow meter was mounted above the channel using the manufacturer supplied wall mounting assembly (see below). The flow meter is housed on two sensor carrier arms and is locked in place by turning a locking handle. A level bubble on the top of the instrument allows fine adjustment to set the instrument level. In addition there is a digital gyroscope compensating for extremely small offsets in X and Y. The unit tested was mains powered (battery powered version also available). The LaserFlow™ was sited at 2.7 metres from the river bed to test the instrument close to the manufactures maximum operational range of 3.0 metres. Installation took around half a day to complete, but more complex installations with extensive ducting may take up to 1-2 days. However, installation is typically far quicker than almost any other type of flow meter.
The measured velocity cell or grid can be configured (by the user) to measure up to 15 different points, comprising of five measurements in the horizontal plane and three in the vertical. Each point velocity measurement is typically formed from 5,000 spectral readings over 5-7 seconds. The vertical readings are taken at 5%,8% & 11% of the total depth from the water surface, up to a maximum depth of 0.15 metres. LaserFlow installation – River Leen, Nottingham
 |
 |
| Side view of the LaserFlow and mounting bracket | Illustration of the velocity cell with approximate position of the laser beam. |
Illustration of the velocity cell with approximate position of the laser beam.
Instrument Dimensions
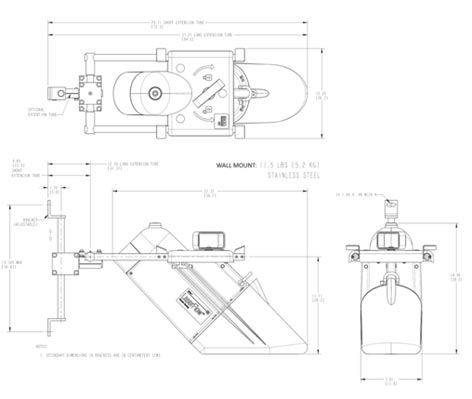
Figure 1. Drawings reproduced from the operating manual
The signal cable from the LaserFlow™ was routed back to the recorder house and terminated at the Signature Flow Meter. This controls and processes data from the external sensor. The Signature can serve as a standalone telemetry logger with Modbus RS-485/SDI-12 inputs or output in Modbus RS- 485 / 4-20mA current loop.
To calculate stream flow without need for a velocity-index equation, the measuring reach must have a uniform velocity profile. The manufacturer recommends that the instrument is positioned so the laser beam strikes the centre of the channel. However, the LaserFlow™ also has an adaptive focus and automatic peak velocity detection feature which is ideal for more demanding hydraulic conditions and can account for more non-uniform flows. Velocity contour mapping is useful to help verify there is an even distribution of velocity over the cross-section. In larger non-uniform channels the instrument would require a velocity-index rating or if the velocity profile is unsteady over time up to three Laser Flow units can be combined in a single channel to better sample the velocity in the channel using the adaptive focus and automatic peak velocity detection feature.
Reference gauge - Thermo Fisher Sarasota 2000 ultrasonic time of flight flow gauge
The LaserFlow was compared against a Sarasota 2000 ultrasonic multipath flow meter which has been operational since 2008. The gauge has four 1 MHz transducer arrays in a non-crossed configuration. Water depth, mean channel velocity, stream flow and path velocities were logged during the trial. The Sarasota 2000 path configuration measures flow to within a measurement uncertainty of Uq95 6.42% to 7.68% (as defined in ISO 6416) over the range of flows that occurred during the test period. Since installation in 2008, the standard error of estimate between the ultrasonic and spot flow gaugings is Se95 12.8%. Residuals of the 28 flow gaugings and ultrasonic discharge are shown below in figure 2. Measurements show a slight positive bias, with the ultrasonic gauge over reporting discharge by an average of 0.017 m3s-1 compared to current meter and FlowTracker gaugings. The ultrasonic flow gauge is considered a good reference for analysing performance of the LaserFlow™ meter with a mean relative error η +4.8%. Errors are reduced at lower discharges, with the accuracy of higher discharge gaugings being affected by the rapid rate of rise and fall of the river inducing greater uncertainties in the calibration measurements. Level measurements taken in a stilling well introduces some errors to the discharge data due to lag when the stage rapidly rises or falls. This results in errors in the area component of the discharge calculation.
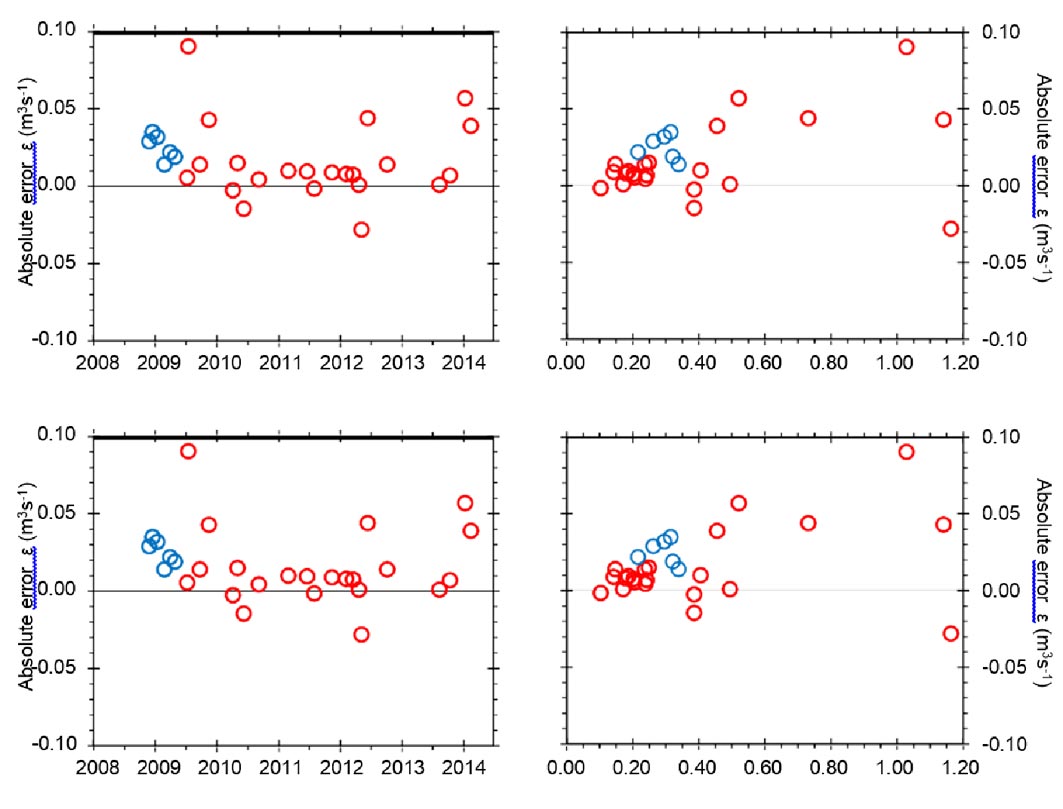
Figure 2. Relative error absolute error of Ultrasonic flows against spot flow gaugings
SonTek FlowTracker gaugings were also taken to give an independent instantaneous discharge comparison. Uncertainty in the 9 gaugings ranged from Uq95 6.0% to 7.4% (ISO 748 method).
Performance analysis
During testing, some diurnal drops in the LaserFlow’s integrated ultrasonic level sensor were observed (Figure 3). This was not replicated in the trace recorded by either the pressure transducer (in river) or the shaft encoder (stilling well). ISCO confirmed this was due to temperature compensation when direct sunlight heats the rear of the instrument where the level sensor is housed. Although this is standard practice, no sunshield was available for this test. It is recommended that a sun shield is installed where direct exposure to solar radiation is possible as with any other globally available ultrasonic level sensor. An external ISCO supplied ultrasonic level sensor (with sunshade) can be used to provide an alternative level input from a stilling well. Stage values from an external pressure transducer were used in the computation of flow from the LaserFlow meter, when depth readings from the ultrasonic were found to be erroneous.
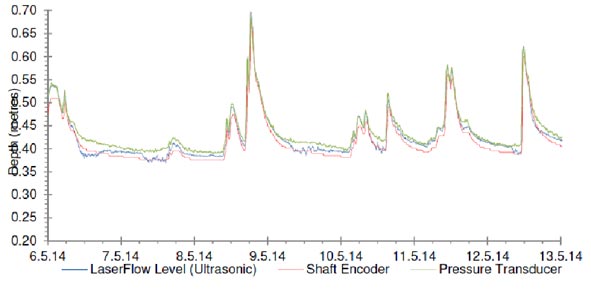
Figure 3. Stage readings taken during the test period showing dips in the LaserFlow™ downward facing ultrasonic level sensor due to temperature compensation issues.
LaserFlow v’s FlowTracker gaugings
Results from a series of spot flow gaugings are detailed in Table 1 with corresponding discharge data recorded by the LaserFlow™. The LaserFlow™ had a mean absolute error of ε -0.007 m3s-1. The greatest error was -0.061 m3s-1, which is probably related to a rapidly falling stage during the gauging, as all other measurements show much lower errors. Based on comparisons between the LaserFlow™ and reference flow, the maximum relative error was η -6.0%. No bias was observed in the discharge measurements of the LaserFlow™ with an equal distribution of measurements either side of the FlowTracker gauging and two measurements at sub-litre accuracy of the reference flow. River conditions provided only a limited discharge range (0.23 to 1.08 m3s-1) to gauge during the test period. However a sufficient increase in flow and velocity were recorded to detect any bias or operational issues had they occurred.
Figure 4 shows the LaserFlow™ measurements plotted against the equivalent FlowTracker and Sarasota 2000 readings. Error bars show the measurement error calculated for each FlowTracker gauging and Sarasota 2000 ultrasonic measurements using methods defined in ISO 748 (gauging) and ISO 6416 (ultrasonic transit time). Errors are expressed at 95% confidence level Uq95. In all cases data from the LaserFlow™ are contained within the error bounds of both reference flow measurements, giving a high degree of confidence in the data at a range of discharges.
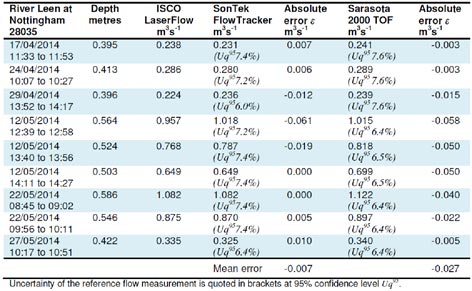
Table 1. Flow gaugings and corresponding flow meter readings taken during test
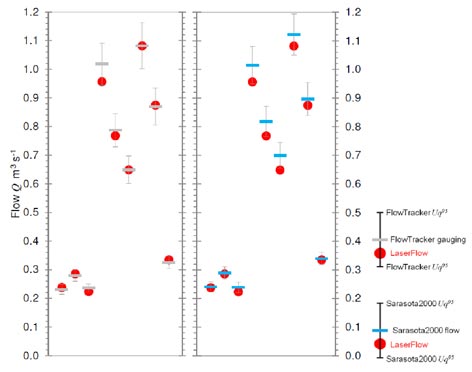
Figure 4. Laser flow measurements relative to a) FlowTracker gauging and b) Sarasota 2000 data.
Error bars are expressed as the combined uncertainty of the reference flow at 95% confidence level Uq95.
LaserFlow™ v’s Sarasota 2000 transit time ultrasonic flow meter
A distinct trend was evident when directly comparing flows from the two flow meters (table 1). The ultrasonic gauge over reported discharge compared to the LaserFlow™ by an average of ε -0.027 m3s-1. The greatest errors were observed at higher discharges, with deviation at lower flows considerably less. This trend was also evident in the historical performance of the Sarasota 2000 gauge at high flows and is not present when the LaserFlow™ readings are compared against FlowTracker gaugings. This degree of bias is expected if the LaserFlow was in closer agreement with the actual discharge than the Sarasota2000 measured flow (based on the historic performance of the ultrasonic gauge). Comparing the logged data the standard error of estimate was Se95 ±12.0%. The mean relative error of all observations was η -2.59%
Increased deviation is evident at higher discharges, but still generally within η ±20%. Several factors are thought to be responsible. The stilling well shows some lag in response, compared to the in river level sensors. As wetted area is computed in the Sarasota 2000 from the shaft encoder level sensor operated in the stilling well. This lag induces error in the area calculation. The LaserFlow™ calculates cross-section area using stage data from its internal ultrasonic sensor which is not subject to any lag effects, but does suffer from temperature compensation error when in direct sunlight if a sunshade is not used. These errors have been corrected in Figure 5 using a common area calculation to provide a more direct comparison of the measured water velocity by both instruments.
Removing some of the sources of error, reduces the relative error considerably (figure 5). The standard error of estimate reduces down to Se95 ±7.7% which results in a standard error close to the measurement uncertainty of the ultrasonic gauge.
Another significant source of error is in the sampling intervals of the two gauges. The Sarasota2000 has a cycle time of 1 minute, with an averaging period of 15 minutes. The LaserFlow can be programmed to take between 1,000 and 10.000 spectral readings per sample point, with up to a maximum of 15 points configurable in the velocity cell. A complete scan of the velocity cell typically takes 45 to 60 seconds, however the flow output is not averaged over a 15 minute period like the Sarasota2000. Consequently some hysteresis is introduced when directly comparing stream flow from the two flow meters, which is especially prevalent during rapidly varying stages which occurs at on the River Leen due to the highly urbanised catchment area.
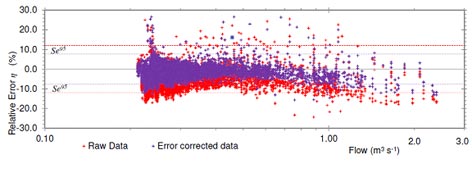
Figure 5. Relative error residuals of discharge measurements taken by the LaserFlow™ and Sarasota gauges. Error correction has been applied to remove wetted area calculation errors associated with the downward facing ultrasonic and stilling well lag.
Velocity analysis
Velocity measurements are taken at up to 15 different points in the cross-section to produce the LaserFlow’s velocity cell. The current firmware samples 3 points down in the vertical at 5%,8% & 11% of the total depth from the water surface, up to a maximum depth of 0.15 metres. Note algorithms in the sensor firmware limit the depth to which the laser can penetrate. Five velocity measurements are made in the horizontal plane. The spacing depends on the relative distance from the instrument. At a height of 2.7 metres from the river bed, the velocity cell is approximately 0.35 metres wide.
Data from the velocity cell in Figure 6 shows some typical measurements collected during a single sampling interval. Depending on the number of measurement points configured and number of spectral readings sampled a single swathe of the velocity cell typically takes 45 to 60 seconds.
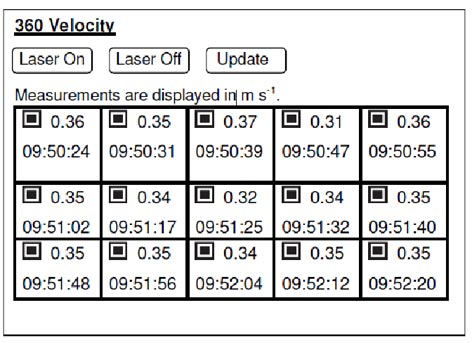 Figure 6. Typical Data readout from the LaserFlow display
To see how velocities measured by the LaserFlow™ velocimeter compare to velocities measured by an acoustic Doppler velocimeter. A FlowTracker was used to take measurements just upstream of the Laser beam. Velocity measurements were taken at 0.02 metres (5%), 0.03 metres (8%) and 0.05 metres (11%) depths below the water surface. The display on the Signature display only showed velocimeter readings to centimetre per second resolution although it does measure in millimeters. Accounting for the disturbance in the water caused by the acoustic probe and natural pulsing of the river, comparisons confirm the Laser velocimeter is extremely accurate. A non-contact instrument has the added advantage of being free from any disturbance caused by the presence of a sensor in the sampling volume.
An assessment of velocity measured by the LaserFlow™ against the mean channel velocity from the Sarasota 2000 is presented in figure 7. The ratio of the velocity cell to the mean channel velocity remains relatively constant as depth increases. Measuring a consistent proportion of the mean velocity is important for accurate determination on discharge. Some hysteresis is evident at higher velocities which can be attributed to the different sampling periods of the two instruments not being synchronised, which becomes more significant during rapidly varying velocities. Where the channel is wider than the sampling width of the LaserFlow™, total discharge is calculated by applying a scaling factor to the velocity cell data, in order to relate it to mean channel velocity. For accurate estimation of mean velocity, the ratio between the LaserFlow™ velocity cell and the mean velocity must be linear or else depth will need to be factored in the flow computation. The test site has a relatively uniform velocity profile due to the straight approach and uniform cross-section profile. Velocity cell data in figure 7 shows a stable relationship to the mean velocity recorded by the Sarasota 2000. Analysis of the flow meter data indicates in open channels of uniform cross section the LaserFlow™ has the potential to determine the mean cross-section velocity and produce accurate flow data at a range of discharges. Where the cross-section velocity profile is unsteady over time, a second or third LaserFlow™ unit may be required to measure a greater proportion of the horizontal channel velocity.
A linear relation also holds between the velocity cell data and the gauged mean velocity measured by the FlowTracker (blue cross). A linear regression to the nine points gives a coefficient of determination of R2 0.9956.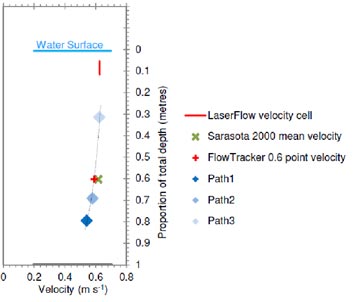
Figure 7. Mean channel velocity measured by the Sarasota 2000 and FlowTracker relationship with the LaserFlow’s measured velocity cell. Red points represent mean velocity measured using two ultrasonic paths and black points where three paths are firing. Blue crosses mean channel velocity measured by the FlowTracker
Figure 8 shows the velocity distribution in the water column as measured by the three velocimeters at various depths. A classic velocity profile is evident at the test site with mean velocity occurring at a depth of 0.6 from the water surface. The velocity measured by the LaserFlow™ is sampling the water column at zone of maximum water speed in the vertical. If sampling channels with lower depths, the velocity cell could be profiling very near the surface so would need to compensate if the velocity profile bends back at the surface.
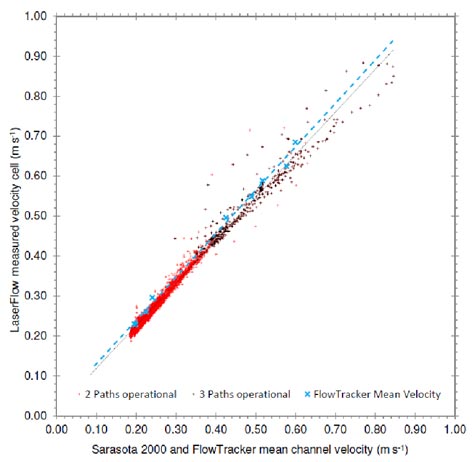
Figure 8. Measured velocity distribution
Velocity data from the time-of-flight transducer paths is shown in figure 9 along with velocity cell data from the LaserFlow™. Paths 1 and 2 are mounted 0.12 metres and 0.18 metres from the bed so are constantly operational. Path 3 fires at depths above 0.46 metres (green line). The LaserFlow™ velocity cell measures a velocity above that measured by paths 1 and 2 owing to the velocity cells position above both transducers in the water column. When transducer path 3 fires it measures a current similar to the velocity cell of the LaserFlow™, with both sampling points being at similar relative depths. Data from velocity path 3 provides useful evidence the Laser diode accurately measures sub surface velocities using the Doppler shift principle.
As the LaserFlow™ measures velocity relatively near the water surface, sites that experience significant wave action or strong wind fetch may require the velocity cell to be limited to the lowest profile depth. A wave amplitude of 20-30 mm was experienced during the trial but this did not appear to trouble the velocity measurements or instrument performance. At sites where the wave amplitude is in excess of the velocity cell depth (>5% of the total depth), wave height may become an issue but would require further testing to confirm.
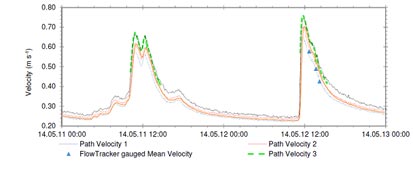
Figure 9. Transducer path data from the Sarasota 2000 and Velocity cell data measured by the LaserFlow.
Results
In field tests the LaserFlow™ performed exceptionally well with respect to both reference flows. Compared to the nine FlowTracker gaugings the maximum relative error was η -6.0% with no bias present in the measurements.
During the 40 day trial, discharge recorded at the site ranged from 0.21 to 2.40 m3s-1. The average relative error between the two flow metres was η -0.89%. The accuracy achieved by the LaserFlow was comparable to the Sarasota 2000 gauge in the environment tested.
Compared to the reference flow (9 FlowTracker gaugings), the LaserFlow™ (η -0.5%) outperformed the Sarasota 2000 (η +3.4%).
Velocity data measured by the laser diode recorded comparable data to conventional hydro-acoustic instruments (ultrasonic transit time and Doppler shift acoustic velocimeters). Water speeds between 0.19 m s-1 and 1.04 m s-1 were recorded during the trial verifying performance at high and low velocities.
Conclusions
Test data shows the LaserFlow™ could be confidently installed as a flow measurement device at channels similar to the trial site. The accuracy of the data is sufficient to meet the Environment Agency’s requirements for open channel flow measurement in its hydrometric network.
Test results suggests channel widths of 3-4 metres is the upper limit for a single LaserFlow™ sensor to compute discharge without the need for connecting additional LaserFlow™ sensors owing to the proportion of unmeasured flow in channels of greater width. A maximum of 3 LaserFlow™ sensors can be connected together to feed velocity data back to the Signature Flow meter which calculates discharge from the velocity readings. This would extend the channel width the instrument could measure. Prior to any site being considered for deployment, a good understanding of the velocity profile in the cross section is imperative at a range of discharges. In rivers where the velocity profile is non-uniform and unsteady, the LaserFlow™ may not measure a sufficient proportion of the cross section to accurately determine discharge. However, up to 3 LaserFlow sensors can be connected to a single transmitter.
The test site provided a secure location to install the instrument. Consideration would need to be given to the security of other sites should the instrument be installed in a location where is cannot be easily concealed. Without suitable secure mounting it will be vulnerable to vandalism or displacement. Public access to the channel and/ or instrument should also be considered. Although the 3R laser is unlikely to cause any damage to the human eye, it is recommended direct eye exposure should be avoided.
Temperature compensation issues when the ultrasonic transducer on the LaserFlow™ is exposed to direct solar radiation caused some problems with the depth measurement. If deployed at an exposed site, a sunshield would need to be positioned over the instrument to prevent errors in the data. Alternatively a secondary external level sensor connected to the signature flow processor could be used.
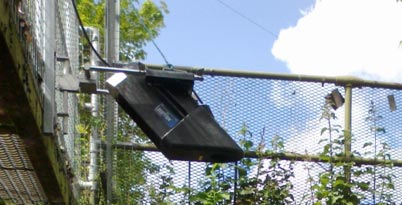
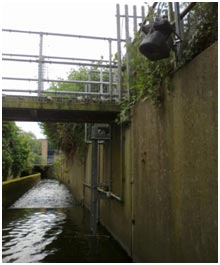
The LaserFlow™ must be mounted above the channel and centred approximately in the middle of the cross section. This limits deployment to sites where an overhead structure is present, such as bridge or culvert. The instrument was temporarily fixed to the side of the channel wall, at an angle of 45º to the flow (see below). At this angle the instrument still measured velocity, albeit not equal to the downstream velocity component due to the skewed angle the laser was pointing. Installing the LaserFlow™ meter at the channel edge requires further investigation. But such positioning could allow the velocity data to be correlated to the mean channel velocity and used similar to a sidelooker. If the instrument was not able to be positioned directly over water, an external ultrasonic transducer would be required.
Right: Temporary installation on the left bank channel wall
Acknowledgements
Thanks to Rob Stevens at RSHydro for supplying the LaserFlow™ meter and help installing the instrument. The technical advice and input during the trial was invaluable.
Contact Details: RS Hydro, Leask House, 128 Hanbury Road, Stoke Prior, Worcestershire, B60 4JZ
www.rshydro.co.uk info@rshydro.co.uk Tel: +44(0)1527 882060
References
ISO 748(E). 2007. Hydrometry — Measurement of liquid flows in open channels using current-meters or floats. ISO. Geneva. Switzerland. P48.
ISO 6416(E). 2005. Hydrometry — Measurement of discharge by the ultrasonic (acoustic) method. ISO. Geneva. Switzerland. P52.
SonTek/YSI. 2009. FlowTracker® Handheld ADV® – Technical Manual. SonTek/YSI Inc. California. USA. P126.
Thermo Electron. 2005. Sarasota 2000 Ultrasonic Flowmeter – Handbook. Thermo Electron Corporation. Cheshire. UK. P141.
Teledyne ISCO. 2013. TIENet™ 360 LaserFlow™ Velocity Sensor – Installation and Operation Guide. ISCO. Nebraska. USA. P118.
Time series data collected during the trial
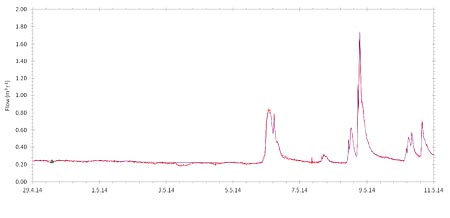
Discharge hydrographs recorded during trial period 29th April to 11th May 2014